

Prediabetes is not a catastrophe, and it is not “almost diabetes” in the dramatic sense people often imagine. But it is also not a meaningless lab quirk. It is a metabolic warning sign: glucose regulation is already starting to drift, and the risk of moving toward type 2 diabetes, fatty liver disease, and cardiovascular problems is higher than it should be.
The good news is that this stage is often highly responsive to action. Prediabetes is one of the clearest examples in medicine where early lifestyle changes can alter the course rather than simply decorate the numbers on a lab report. That is why the right tone is neither panic nor denial. It is attention.
The biggest mistake people make is treating lab results like a verdict. The second biggest mistake is brushing them off with, “It’s only a little high.” The truth sits in between. These tests are useful because they tell you two things: how far off track glucose metabolism may already be, and whether this is a moment to watch, or a moment to act.
The three tests that matter most
In routine clinical practice, prediabetes is mainly assessed with three tests: HbA1c, fasting plasma glucose, and the 2-hour glucose value from an oral glucose tolerance test, or OGTT.
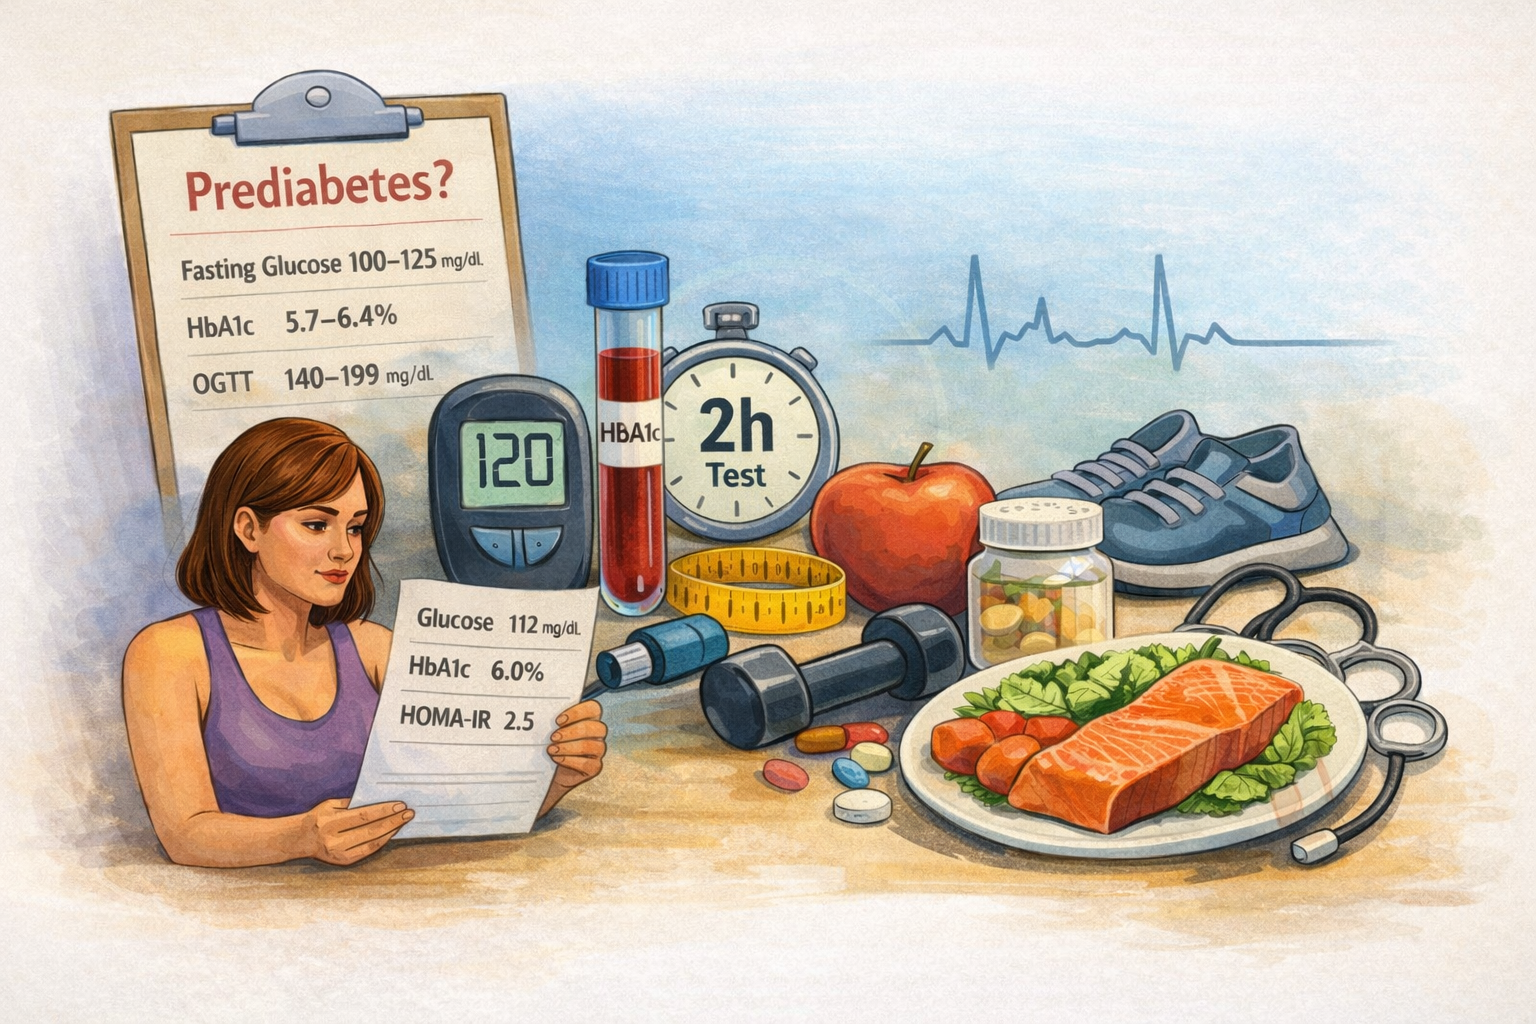
These are the numbers most people will see:
- HbA1c: 5.7% to 6.4%
- Fasting plasma glucose: 100 to 125 mg/dL
- 2-hour glucose after OGTT: 140 to 199 mg/dL
What matters is not only whether a value crosses into the prediabetes range, but where it sits within that range. An HbA1c of 5.7% and an HbA1c of 6.4% do not mean the same thing in practical terms, even though both technically fall under the same label. The closer the result is to the diabetic threshold, the higher the risk tends to be. The same applies to fasting glucose: 101 mg/dL and 124 mg/dL should not be read with the same level of urgency.
This is one of the most important mindset shifts for patients and readers: prediabetes is not a single box. It is a spectrum.
Why one normal test does not always settle the question
People often assume that if fasting glucose is normal, the situation must be fine. That is too simplistic.
HbA1c, fasting glucose, and OGTT do not identify exactly the same people. Someone may have a normal fasting glucose but an elevated HbA1c. Another person may have a normal HbA1c while the OGTT already shows impaired glucose tolerance. This is why a single “good” number does not always tell the full story.
Each test sees something slightly different.
HbA1c reflects average glucose exposure over the previous two to three months. It is convenient because it does not require fasting. Fasting glucose is simple and widely available, but it captures only one moment. OGTT is often more sensitive for early dysglycemia, especially when post-meal glucose handling is the first thing to worsen, but it is less convenient and therefore used less often in everyday practice.
If there is excess weight, a strong family history, fatty liver, prior gestational diabetes, or borderline results on other tests, a normal fasting glucose alone should not be treated as a final answer.
When this becomes something to act on
The question most people really want answered is not, “Do I technically have prediabetes?” It is, “At what point should I stop casually watching this and actually do something?”
A useful way to think about it is this: the more your numbers gather near the upper end of the range, and the more other risk factors travel with them, the less sense it makes to stay passive.
That means action becomes more important when:
- HbA1c is trending closer to 6.0% to 6.4%
- fasting glucose is moving toward the upper end of the prediabetes range
- more than one glucose marker is abnormal
- weight or waist circumference is increasing
- triglycerides are elevated or HDL is low
- blood pressure is rising
- there is a history of gestational diabetes
- there are signs of fatty liver
- physical activity is low
- there is a strong family history of type 2 diabetes
This does not mean everyone in this position needs medication. It means this is no longer a “check it again someday” situation. This is where structured lifestyle intervention becomes worth taking seriously.
HbA1c versus fasting glucose: which one should you trust?
People often want one clean winner. In reality, each test has strengths and limits.
HbA1c is useful because it reflects longer-term glycemic exposure and does not depend on whether you happened to sleep badly, exercise the night before, or show up slightly dehydrated. But it is also influenced by red blood cell turnover and can be misleading in certain medical conditions.
Fasting glucose is simple and familiar, but it is more variable and can be affected by short-term factors. It is a useful test, but not a perfect summary of overall glucose metabolism.
The practical takeaway is not that one is always better. It is that discordance happens, and that discordance is clinically meaningful. If HbA1c and fasting glucose do not tell the same story, or if the clinical picture suggests risk despite one reassuring result, that is a reason to look deeper, not a reason to cherry-pick the nicer number.
Where insulin and HOMA-IR fit in
This is where online discussions often go off the rails.
Fasting insulin and HOMA-IR can provide useful context about insulin resistance. They may help explain why someone is gaining abdominal fat, why triglycerides are high, or why glucose markers are drifting upward even before overt diabetes appears.
But they are not the core diagnostic tools for prediabetes in routine guidelines.
That distinction matters. Many people see a mildly elevated fasting insulin or HOMA-IR and assume they have discovered the real diagnosis hiding behind the official one. In reality, these markers are better understood as supporting clues rather than primary decision-makers.
There are two reasons for that.
First, major clinical recommendations center on HbA1c, fasting glucose, and OGTT when identifying prediabetes. Second, HOMA-IR does not have one universally accepted cut-off that works cleanly across all populations and clinical settings. Different studies and centers use different thresholds, which makes it much harder to treat as a universal yes-or-no marker.
So how should a reader interpret it?
If glucose markers are normal and HOMA-IR is only mildly elevated, that is not a reason for panic. It is a reason to step back and look at the full metabolic picture: waist circumference, body weight, lipids, liver health, activity level, sleep quality, and trends over time.
If glucose markers are already abnormal and fasting insulin is high, that may reinforce the picture of insulin resistance, but it still does not replace the standard glucose-based tests.
In plain language: HOMA-IR can add color. It should not become the whole painting.
What actually drives risk, beyond “too much sugar”
One of the laziest ways to talk about prediabetes is to reduce it to eating sweets. That misses the real mechanism and leads people to focus on the wrong things.
The strongest lifestyle lever is usually body weight, especially excess visceral fat. For many people, a modest but sustained reduction in weight has a meaningful effect on glucose metabolism. This is not theoretical. Large prevention trials consistently showed that relatively moderate weight loss, combined with regular physical activity, can substantially reduce the risk of progressing to type 2 diabetes.
The second major lever is movement. Not just formal exercise, but the overall pattern of physical activity and sedentary time. A body that spends most of the day sitting, while carrying excess adiposity, becomes metabolically less flexible. Insulin sensitivity worsens. Post-meal glucose handling gets worse. Cardiorespiratory fitness falls. This is why the story is much bigger than dessert.
The third lever is overall dietary pattern, not a single ingredient. Prediabetes risk is shaped less by isolated sugar intake and more by a broader pattern: calorie excess, easy overeating, frequent ultra-processed foods, sugary drinks, processed meats, low fiber intake, and a diet that quietly drives weight gain and insulin resistance over time.
This is why the best dietary approaches are usually not the most dramatic ones. The useful question is not whether someone is “allowed” fruit or carbs. The useful question is whether their eating pattern helps them reduce excess fat mass, stabilize appetite, improve diet quality, and make the plan sustainable.
For many people, Mediterranean-style eating works well. For others, a lower-carbohydrate pattern is easier to sustain. The common denominator is not ideology. It is adherence and metabolic effect.
The fourth lever is sleep. Poor sleep, short sleep, and chronically disrupted schedules are strongly tied to appetite dysregulation, weight gain, lower activity, and poorer insulin sensitivity. This is one reason generic advice often fails: someone who is exhausted, under-slept, and stressed does not just need “better discipline.” They need a realistic plan that accounts for the physiology of fatigue.
The fifth lever is smoking and nicotine exposure. It is often ignored in popular discussions, but it belongs in the same metabolic conversation.
In other words, prediabetes is rarely about one villain. It is usually the result of a pattern: rising weight, reduced movement, poor recovery, easy hyper-palatable food, often visceral fat, often fatty liver, often years of subtle drift before the first alarming lab result appears.
What the big prevention studies actually showed
One reason prediabetes deserves attention is that prevention is not just a theoretical promise. The evidence is unusually strong.
Large trials such as the Diabetes Prevention Program showed that intensive lifestyle change reduced the risk of developing type 2 diabetes far more than doing nothing, and even more than metformin in the original comparison. The core target was not extreme transformation. It was roughly 7% weight loss and at least 150 minutes of moderate physical activity per week.
That is important because it reframes the discussion. Prevention is not about becoming perfect. It is about achieving enough metabolic improvement, consistently enough, to change the trajectory.
Long-term follow-up studies showed that the benefit does not have to disappear after the initial intervention period. The effect weakens over time, as most real-life effects do, but it remains meaningful.
This is exactly why prediabetes should not be handled with either melodrama or indifference. It is serious enough to merit action, but modifiable enough to reward it.
How to read your own labs without panic
A good way to read prediabetes labs is to ask four questions.
First: which marker is abnormal?
Is it HbA1c, fasting glucose, OGTT, or more than one?
Second: how far into the range is it?
A value just over the threshold does not carry the same meaning as one near the upper edge.
Third: is this isolated or part of a broader metabolic pattern?
What is happening with body weight, waist circumference, triglycerides, HDL, blood pressure, liver enzymes, sleep, and activity?
Fourth: what is the trend?
A single mildly abnormal result is different from a steady upward drift over several years.
That last point matters more than most people realize. Metabolism usually worsens gradually. By the time one number crosses a threshold, the process has often been underway for a while. This is why trend-reading is often more useful than reacting emotionally to one result.
The right conclusion
Prediabetes is not a reason to panic. But it is also not a result to “keep an eye on” in the vague, lazy sense people often mean.
It is better understood as a window.
A window in which glucose regulation is starting to slip, but before the process is locked in. A window in which modest weight loss, regular movement, improved diet quality, better sleep, and a more coherent routine can still make a measurable difference. A window in which lab interpretation should become more thoughtful, not more dramatic.
The goal is not to be frightened by numbers. The goal is to read them correctly.
And the most useful message for most readers is simple: the earlier you treat prediabetes like something real, the less likely it is to become something worse.
Sources
- American Diabetes Association. Standards of Care in Diabetes—2026.
https://doi.org/10.2337/dci26-S000 - National Institute of Diabetes and Digestive and Kidney Diseases (NIDDK). Recommended Tests for Identifying Prediabetes.
https://www.niddk.nih.gov/health-information/professionals/clinical-tools-patient-management/diabetes/game-plan-preventing-type-2-diabetes/prediabetes-screening-how-why/recommended-tests-identifying-prediabetes - US Preventive Services Task Force. Screening for Prediabetes and Type 2 Diabetes.
https://www.uspreventiveservicestaskforce.org/uspstf/recommendation/screening-for-prediabetes-and-type-2-diabetes - NICE. Type 2 Diabetes: Prevention in People at High Risk (PH38).
https://www.nice.org.uk/guidance/ph38 - Knowler WC, Barrett-Connor E, Fowler SE, et al. Reduction in the Incidence of Type 2 Diabetes with Lifestyle Intervention or Metformin. New England Journal of Medicine. 2002.
https://www.nejm.org/doi/full/10.1056/NEJMoa012512 - Diabetes Prevention Program Research Group. Long-term Effects of Lifestyle Intervention or Metformin on Diabetes Development and Microvascular Complications over 15-year Follow-up: the DPP Outcomes Study. The Lancet Diabetes & Endocrinology. 2015.
https://pubmed.ncbi.nlm.nih.gov/26377054/ - Tuomilehto J, Lindström J, Eriksson JG, et al. Prevention of Type 2 Diabetes Mellitus by Changes in Lifestyle among Subjects with Impaired Glucose Tolerance. New England Journal of Medicine. 2001.
https://www.nejm.org/doi/full/10.1056/NEJM200105033441801 - Lindström J, Ilanne-Parikka P, Peltonen M, et al. Sustained Reduction in the Incidence of Type 2 Diabetes by Lifestyle Intervention: Follow-up of the Finnish Diabetes Prevention Study. The Lancet. 2006.
https://www.sciencedirect.com/science/article/abs/pii/S0140673606697018 - Li G, Zhang P, Wang J, et al. The Long-Term Effect of Lifestyle Interventions to Prevent Diabetes in the China Da Qing Diabetes Prevention Study: a 20-year Follow-up Study. The Lancet. 2008.
https://pubmed.ncbi.nlm.nih.gov/18502303/ - Ramachandran A, Snehalatha C, Mary S, et al. The Indian Diabetes Prevention Programme Shows that Lifestyle Modification and Metformin Prevent Type 2 Diabetes in Asian Indian Subjects with Impaired Glucose Tolerance. Diabetologia. 2006.
https://pubmed.ncbi.nlm.nih.gov/16391903/ - AACE. Clinical Practice Guideline: Developing a Diabetes Mellitus Comprehensive Care Plan—2022 Update.
https://pro.aace.com/clinical-guidance/2022-clinical-practice-guideline-development-diabetes-mellitus-comprehensive - Matthews DR, Hosker JP, Rudenski AS, et al. Homeostasis Model Assessment: Insulin Resistance and Beta-Cell Function from Fasting Plasma Glucose and Insulin Concentrations in Man. Diabetologia. 1985.
https://link.springer.com/article/10.1007/BF00280883 - Otten J, Ahrén B, Olsson T. Surrogate Measures of Insulin Sensitivity vs the Hyperinsulinaemic-Euglycaemic Clamp: a Meta-analysis. Diabetologia.
https://link.springer.com/article/10.1007/s00125-014-3226-x - Prospective data on HOMA-IR and progression risk:
https://pmc.ncbi.nlm.nih.gov/articles/PMC9926772/ - ESC. 2023 ESC Guidelines for the Management of Cardiovascular Disease in Patients with Diabetes.
https://www.escardio.org/guidelines/clinical-practice-guidelines/cvd-and-diabetes